Working as a sales executive is one of the most competitive jobs that keep you engaged with time-to-time sales performance and you will always find salespeople on their toes swapping their tasks such as cold calling, sending proposals, attending meetings, finding prospects and closing deals.5 Features of Sales Dashboard: 80% Successful Salespeople Follow it. Do you think such unending tasks can be sorted on different spread sheets or just putting reminders on your mobile would be enough? Well, the answer is a BIG NO because that is where the usage of sales dashboard assists in determining the sales performance, analyzing the reports, understanding lead metrics and your sales pipeline month-on-month. Sales dashboards provide accurate result of your KPIs and make you organized to evaluate your progress.
Here are 5 key features of Sales Dashboard that will compel you to use them as part of your sales cycle.

- Forecast Report
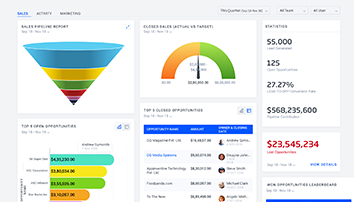
It is a big time challenge for any sales rep to achieve the sales target within stipulated time frame. When it comes to access the real-time data, the sales forecast report provides an overview of your past and future sales performance in terms of committed amount, best-case amount and pipeline of qualified leads to work for next month. The sales dashboard at SalezShark provides you the complete statistics of the leads generated by every sales rep. You can also view any open opportunities in your sales account and the share of revenue you have contributed this month/year. Primarily, it assists you in planning your next month sales agenda, wherein you either need to look out for more leads, or close your pending deals.
- Sales Speedometer
If you think of your car dashboard, it will remind you of the speedometer that shows your speed while driving as fast as light. Similarly, a sales dashboard provides you a glimpse of evident metrics and business targets in a single glance to know your sales speed well. This real-time data visual makes you aware of your actual sales vs. the target sales, with an estimated value from the closed sales as well. This metric will also inform you about the status of your sales target depending upon your requirement. By regularly checking the sales speedometer, you can be assured of your qualified leads that have been added to your sales pipeline month-on-month.
- Actionable Leaderboard
Another effective way to boost productivity and accountability for your sales analytics process is to present a sales leaderboard among your sales professionals. A leaderboard helps to increase transparency and sales activities so that managers can check the real-time performance and drive better results against a time-bound target. This actionable leaderboard at SalezShark is also getting upgraded into Smart TV plug-in to display team’s performance and at the same time, providing public recognition to sales personnel.
- Biggest Sales Pipeline
Dashboards turn any raw figures into attractive visuals that assist salespeople to figure out their progress and areas that require immediate improvement. Since leads are the pillars of your sales mansion, the bigger the deals, the faster you will achieve your sales target. To get you focused towards your plethora of sales stages, this feature lets you analyse the different verticals of your prospect. When it comes to make the difference, each sales stage like prospecting, proposal, closed/won, dropped are differentiated with different colors to present the information coherently. It helps in tracking the lead, analyzing the current target ratio and planning the next step that needs to be taken with the number of open opportunities you have.
- Open Opportunities
Such open opportunities act as the gateway to see the critical reporting and metrics information in a single glance. Based on the feasibility of winning or losing the deal, prospects are categorized on the basis of an estimated value that will be demonstrated while making the sale. The opportunity metric also showcases the efforts of the salespeople that have been invested throughout the year in winning or losing the deals. Though the metric is sorted with green (won) and red (lost) color that present a reasonable ratio of measuring the unending efforts of salespeople.
The right usage of sales dashboards assist you in prioritizing your sales activities and leverage your sales performance by analyzing last month’s sales to the sales of this month. Besides, it also helps you in organizing your day-to-day sales tasks and simultaneously presents a clear picture of your new sales opportunities, or feasibility of closing the previous deals so that you can achieve your sales target on time.
If you wish to learn more about the features of SalezShark sales dashboard, do request for the FREE trail by calling on 9015731800 or drop us a line at contact@salezshark.com.
